oasification.com

Curve number tables

MODIPE is based on the Soil Conservation Service Curve Number method.

To choose the curve number of a zone we must use tables that appear in most of the Hydrology books. The question is to choose from the table the more similar description to the studied zone.

The resulting curve number is inside the interval 0-100.

High curve numbers imply high run-off (=poor infiltration; =degraded slopes). On the other hand, low curve numbers guarantee high infiltration rates, low surface run-off and low hydric erosion.

In this spot of the web site we reproduce the main curve number table, so it's at hand for the user. We have also developed a Visual basic application that let you choose curve numbers automatically. This is the program NUMCUR 10 IE, in bilingual version (English-Spanish) and with a number of help windows that appear when pressing F1 key.

We also offer a PDF file (Pequeña guía de uso de MODIPÉ 465 KB , in Spanish), where we have included notes, comments and indications that are needed to use and interprete the tables correctly.

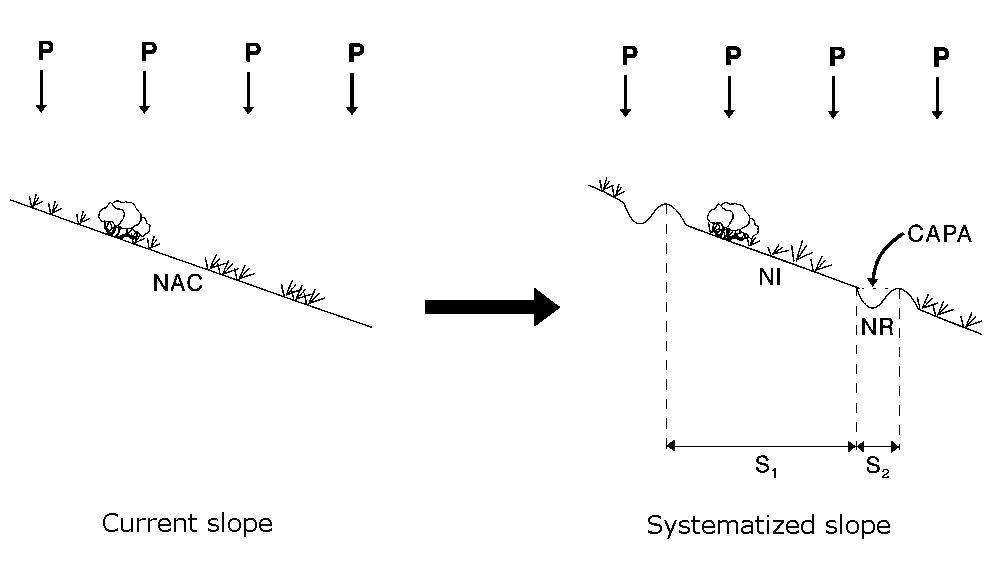
Figure: Input data for MODIPE

GENERAL TABLE

Land use Treatment Hyidrologic condition Soil type
A B C D
Fallow land Naked - 77 86 91 94
CR Poor 76 85 90 93
CR Good 74 83 88 90
Row crops (aligned cultivated soils) R Poor 72 81 88 91
R Good 67 78 85 89
R + CR Poor 71 80 87 90
R + CR Good 64 75 82 85
C Poor 70 79 84 88
C Good 65 75 82 86
C + CR Poor 69 78 83 87
C + CR Good 64 74 81 85
C + T Poor 66 74 80 82
C + T Good 62 71 78 81
C + T + CR Poor 65 73 79 81
C + T + CR Good 61 70 77 80
Small grain (non aligned cultivated soils) R Poor 65 76 84 88
R Good 63 75 83 87
R + CR Poor 64 75 83 86
R + CR Good 60 72 80 84
C Poor 63 74 82 85
C Good 61 73 81 84
C + CR Poor 62 73 81 84
C + CR Good 60 72 80 83
C + T Poor 61 72 79 82
C + T Good 59 70 78 81
C + T + CR Poor 60 71 78 81
C + T + CR Poor 58 69 77 80
Dense leguminous crops or meadows in rotation R Poor 66 77 85 89
R Good 58 72 81 85
C Poor 64 75 83 85
C Good 55 69 78 83
C + T Poor 63 73 80 83
C + T Good 51 67 76 80
Natural pastures - Poor 68 79 86 89
- Fair 49 69 79 84
- Good 39 61 74 80
Pastures C Poor 47 67 81 88
C Fair 25 59 75 83
C Good 6 35 70 79

Permanent meadows (protected from grazing)

- - 30 58 71 78
Brush-grassland, with brush dominating
- Poor 48 67 77 83
- Fair 35 56 70 77
- Good ≤30 48 65 73
Mixture of woods and grassland, woody agriculture crops
- Poor 57 73 82 86
- Fair 43 65 76 82
- Good 32 58 72 79
Woods with pastures
(silvopastoral use)
- Poor 45 66 77 83
- Fair 36 60 73 79
- Good 25 55 70 77
Woods - I Very poor 56 75 86 91
- II Poor 46 68 78 84
- III Fair 36 60 70 76
- IV Good 26 52 63 69
- V Very good 15 44 54 61
Country houses - - 59 74 82 86
Gravel roads - - 72 82 87 89
Asphalt roads - - 74 84 90 92

Abbreviations meaning:

CR=with vegetal residue cover that extends for at least 5% of the soil surface all over the year

R=when soil labours (ploughing, sowing,etc) are made in straight line, without considering the slope

C=when cultivation is made according to contour lines

T=in terraces cultivations (open terraces with drainage for soil conservation)

  Water harvesting